Dataquest Guided Project - Visualizing Earnings Based On College Majors
In this project we will look at earnings from recent college graduates based on each major in ‘recent-grads.csv’. We’ll visualize the data using histograms, bar charts, and scatter plots and see if we can draw any interesting insights from it. However, the main purpose of this project is to practice some of the data visualization tools.
1
2
3
4
5
import pandas as pd
import matplotlib as plt

#jupyter magic so the plots are displayed inline
%matplotlib inline
1
2
recent_grads = pd.read_csv('recent-grads.csv')
recent_grads.iloc[0]
1
2
3
4
5
6
7
8
9
10
11
12
13
14
15
16
17
18
19
20
21
22
Rank                                        1
Major_code                               2419
Major                   PETROLEUM ENGINEERING
Total                                    2339
Men                                      2057
Women                                     282
Major_category                    Engineering
ShareWomen                           0.120564
Sample_size                                36
Employed                                 1976
Full_time                                1849
Part_time                                 270
Full_time_year_round                     1207
Unemployed                                 37
Unemployment_rate                   0.0183805
Median                                 110000
P25th                                   95000
P75th                                  125000
College_jobs                             1534
Non_college_jobs                          364
Low_wage_jobs                             193
Name: 0, dtype: object
1
recent_grads.head(1)
| Rank | Major_code | Major | Total | Men | Women | Major_category | ShareWomen | Sample_size | Employed | ... | Part_time | Full_time_year_round | Unemployed | Unemployment_rate | Median | P25th | P75th | College_jobs | Non_college_jobs | Low_wage_jobs | |
|---|---|---|---|---|---|---|---|---|---|---|---|---|---|---|---|---|---|---|---|---|---|
| 0 | 1 | 2419 | PETROLEUM ENGINEERING | 2339.0 | 2057.0 | 282.0 | Engineering | 0.120564 | 36 | 1976 | ... | 270 | 1207 | 37 | 0.018381 | 110000 | 95000 | 125000 | 1534 | 364 | 193 |
1 rows × 21 columns
1
recent_grads.tail(1)
| Rank | Major_code | Major | Total | Men | Women | Major_category | ShareWomen | Sample_size | Employed | ... | Part_time | Full_time_year_round | Unemployed | Unemployment_rate | Median | P25th | P75th | College_jobs | Non_college_jobs | Low_wage_jobs | |
|---|---|---|---|---|---|---|---|---|---|---|---|---|---|---|---|---|---|---|---|---|---|
| 172 | 173 | 3501 | LIBRARY SCIENCE | 1098.0 | 134.0 | 964.0 | Education | 0.87796 | 2 | 742 | ... | 237 | 410 | 87 | 0.104946 | 22000 | 20000 | 22000 | 288 | 338 | 192 |
1 rows × 21 columns
1
recent_grads.describe()
| Rank | Major_code | Total | Men | Women | ShareWomen | Sample_size | Employed | Full_time | Part_time | Full_time_year_round | Unemployed | Unemployment_rate | Median | P25th | P75th | College_jobs | Non_college_jobs | Low_wage_jobs | |
|---|---|---|---|---|---|---|---|---|---|---|---|---|---|---|---|---|---|---|---|
| count | 173.000000 | 173.000000 | 172.000000 | 172.000000 | 172.000000 | 172.000000 | 173.000000 | 173.000000 | 173.000000 | 173.000000 | 173.000000 | 173.000000 | 173.000000 | 173.000000 | 173.000000 | 173.000000 | 173.000000 | 173.000000 | 173.000000 |
| mean | 87.000000 | 3879.815029 | 39370.081395 | 16723.406977 | 22646.674419 | 0.522223 | 356.080925 | 31192.763006 | 26029.306358 | 8832.398844 | 19694.427746 | 2416.329480 | 0.068191 | 40151.445087 | 29501.445087 | 51494.219653 | 12322.635838 | 13284.497110 | 3859.017341 |
| std | 50.084928 | 1687.753140 | 63483.491009 | 28122.433474 | 41057.330740 | 0.231205 | 618.361022 | 50675.002241 | 42869.655092 | 14648.179473 | 33160.941514 | 4112.803148 | 0.030331 | 11470.181802 | 9166.005235 | 14906.279740 | 21299.868863 | 23789.655363 | 6944.998579 |
| min | 1.000000 | 1100.000000 | 124.000000 | 119.000000 | 0.000000 | 0.000000 | 2.000000 | 0.000000 | 111.000000 | 0.000000 | 111.000000 | 0.000000 | 0.000000 | 22000.000000 | 18500.000000 | 22000.000000 | 0.000000 | 0.000000 | 0.000000 |
| 25% | 44.000000 | 2403.000000 | 4549.750000 | 2177.500000 | 1778.250000 | 0.336026 | 39.000000 | 3608.000000 | 3154.000000 | 1030.000000 | 2453.000000 | 304.000000 | 0.050306 | 33000.000000 | 24000.000000 | 42000.000000 | 1675.000000 | 1591.000000 | 340.000000 |
| 50% | 87.000000 | 3608.000000 | 15104.000000 | 5434.000000 | 8386.500000 | 0.534024 | 130.000000 | 11797.000000 | 10048.000000 | 3299.000000 | 7413.000000 | 893.000000 | 0.067961 | 36000.000000 | 27000.000000 | 47000.000000 | 4390.000000 | 4595.000000 | 1231.000000 |
| 75% | 130.000000 | 5503.000000 | 38909.750000 | 14631.000000 | 22553.750000 | 0.703299 | 338.000000 | 31433.000000 | 25147.000000 | 9948.000000 | 16891.000000 | 2393.000000 | 0.087557 | 45000.000000 | 33000.000000 | 60000.000000 | 14444.000000 | 11783.000000 | 3466.000000 |
| max | 173.000000 | 6403.000000 | 393735.000000 | 173809.000000 | 307087.000000 | 0.968954 | 4212.000000 | 307933.000000 | 251540.000000 | 115172.000000 | 199897.000000 | 28169.000000 | 0.177226 | 110000.000000 | 95000.000000 | 125000.000000 | 151643.000000 | 148395.000000 | 48207.000000 |
First, let’s clean up the data a bit and drop the rows that have NaN as values.
1
2
recent_grads = recent_grads.dropna()
recent_grads
| Rank | Major_code | Major | Total | Men | Women | Major_category | ShareWomen | Sample_size | Employed | ... | Part_time | Full_time_year_round | Unemployed | Unemployment_rate | Median | P25th | P75th | College_jobs | Non_college_jobs | Low_wage_jobs | |
|---|---|---|---|---|---|---|---|---|---|---|---|---|---|---|---|---|---|---|---|---|---|
| 0 | 1 | 2419 | PETROLEUM ENGINEERING | 2339.0 | 2057.0 | 282.0 | Engineering | 0.120564 | 36 | 1976 | ... | 270 | 1207 | 37 | 0.018381 | 110000 | 95000 | 125000 | 1534 | 364 | 193 |
| 1 | 2 | 2416 | MINING AND MINERAL ENGINEERING | 756.0 | 679.0 | 77.0 | Engineering | 0.101852 | 7 | 640 | ... | 170 | 388 | 85 | 0.117241 | 75000 | 55000 | 90000 | 350 | 257 | 50 |
| 2 | 3 | 2415 | METALLURGICAL ENGINEERING | 856.0 | 725.0 | 131.0 | Engineering | 0.153037 | 3 | 648 | ... | 133 | 340 | 16 | 0.024096 | 73000 | 50000 | 105000 | 456 | 176 | 0 |
| 3 | 4 | 2417 | NAVAL ARCHITECTURE AND MARINE ENGINEERING | 1258.0 | 1123.0 | 135.0 | Engineering | 0.107313 | 16 | 758 | ... | 150 | 692 | 40 | 0.050125 | 70000 | 43000 | 80000 | 529 | 102 | 0 |
| 4 | 5 | 2405 | CHEMICAL ENGINEERING | 32260.0 | 21239.0 | 11021.0 | Engineering | 0.341631 | 289 | 25694 | ... | 5180 | 16697 | 1672 | 0.061098 | 65000 | 50000 | 75000 | 18314 | 4440 | 972 |
| 5 | 6 | 2418 | NUCLEAR ENGINEERING | 2573.0 | 2200.0 | 373.0 | Engineering | 0.144967 | 17 | 1857 | ... | 264 | 1449 | 400 | 0.177226 | 65000 | 50000 | 102000 | 1142 | 657 | 244 |
| 6 | 7 | 6202 | ACTUARIAL SCIENCE | 3777.0 | 2110.0 | 1667.0 | Business | 0.441356 | 51 | 2912 | ... | 296 | 2482 | 308 | 0.095652 | 62000 | 53000 | 72000 | 1768 | 314 | 259 |
| 7 | 8 | 5001 | ASTRONOMY AND ASTROPHYSICS | 1792.0 | 832.0 | 960.0 | Physical Sciences | 0.535714 | 10 | 1526 | ... | 553 | 827 | 33 | 0.021167 | 62000 | 31500 | 109000 | 972 | 500 | 220 |
| 8 | 9 | 2414 | MECHANICAL ENGINEERING | 91227.0 | 80320.0 | 10907.0 | Engineering | 0.119559 | 1029 | 76442 | ... | 13101 | 54639 | 4650 | 0.057342 | 60000 | 48000 | 70000 | 52844 | 16384 | 3253 |
| 9 | 10 | 2408 | ELECTRICAL ENGINEERING | 81527.0 | 65511.0 | 16016.0 | Engineering | 0.196450 | 631 | 61928 | ... | 12695 | 41413 | 3895 | 0.059174 | 60000 | 45000 | 72000 | 45829 | 10874 | 3170 |
| 10 | 11 | 2407 | COMPUTER ENGINEERING | 41542.0 | 33258.0 | 8284.0 | Engineering | 0.199413 | 399 | 32506 | ... | 5146 | 23621 | 2275 | 0.065409 | 60000 | 45000 | 75000 | 23694 | 5721 | 980 |
| 11 | 12 | 2401 | AEROSPACE ENGINEERING | 15058.0 | 12953.0 | 2105.0 | Engineering | 0.139793 | 147 | 11391 | ... | 2724 | 8790 | 794 | 0.065162 | 60000 | 42000 | 70000 | 8184 | 2425 | 372 |
| 12 | 13 | 2404 | BIOMEDICAL ENGINEERING | 14955.0 | 8407.0 | 6548.0 | Engineering | 0.437847 | 79 | 10047 | ... | 2694 | 5986 | 1019 | 0.092084 | 60000 | 36000 | 70000 | 6439 | 2471 | 789 |
| 13 | 14 | 5008 | MATERIALS SCIENCE | 4279.0 | 2949.0 | 1330.0 | Engineering | 0.310820 | 22 | 3307 | ... | 878 | 1967 | 78 | 0.023043 | 60000 | 39000 | 65000 | 2626 | 391 | 81 |
| 14 | 15 | 2409 | ENGINEERING MECHANICS PHYSICS AND SCIENCE | 4321.0 | 3526.0 | 795.0 | Engineering | 0.183985 | 30 | 3608 | ... | 811 | 2004 | 23 | 0.006334 | 58000 | 25000 | 74000 | 2439 | 947 | 263 |
| 15 | 16 | 2402 | BIOLOGICAL ENGINEERING | 8925.0 | 6062.0 | 2863.0 | Engineering | 0.320784 | 55 | 6170 | ... | 1983 | 3413 | 589 | 0.087143 | 57100 | 40000 | 76000 | 3603 | 1595 | 524 |
| 16 | 17 | 2412 | INDUSTRIAL AND MANUFACTURING ENGINEERING | 18968.0 | 12453.0 | 6515.0 | Engineering | 0.343473 | 183 | 15604 | ... | 2243 | 11326 | 699 | 0.042876 | 57000 | 37900 | 67000 | 8306 | 3235 | 640 |
| 17 | 18 | 2400 | GENERAL ENGINEERING | 61152.0 | 45683.0 | 15469.0 | Engineering | 0.252960 | 425 | 44931 | ... | 7199 | 33540 | 2859 | 0.059824 | 56000 | 36000 | 69000 | 26898 | 11734 | 3192 |
| 18 | 19 | 2403 | ARCHITECTURAL ENGINEERING | 2825.0 | 1835.0 | 990.0 | Engineering | 0.350442 | 26 | 2575 | ... | 343 | 1848 | 170 | 0.061931 | 54000 | 38000 | 65000 | 1665 | 649 | 137 |
| 19 | 20 | 3201 | COURT REPORTING | 1148.0 | 877.0 | 271.0 | Law & Public Policy | 0.236063 | 14 | 930 | ... | 223 | 808 | 11 | 0.011690 | 54000 | 50000 | 54000 | 402 | 528 | 144 |
| 20 | 21 | 2102 | COMPUTER SCIENCE | 128319.0 | 99743.0 | 28576.0 | Computers & Mathematics | 0.222695 | 1196 | 102087 | ... | 18726 | 70932 | 6884 | 0.063173 | 53000 | 39000 | 70000 | 68622 | 25667 | 5144 |
| 22 | 23 | 2502 | ELECTRICAL ENGINEERING TECHNOLOGY | 11565.0 | 8181.0 | 3384.0 | Engineering | 0.292607 | 97 | 8587 | ... | 1873 | 5681 | 824 | 0.087557 | 52000 | 35000 | 60000 | 5126 | 2686 | 696 |
| 23 | 24 | 2413 | MATERIALS ENGINEERING AND MATERIALS SCIENCE | 2993.0 | 2020.0 | 973.0 | Engineering | 0.325092 | 22 | 2449 | ... | 1040 | 1151 | 70 | 0.027789 | 52000 | 35000 | 62000 | 1911 | 305 | 70 |
| 24 | 25 | 6212 | MANAGEMENT INFORMATION SYSTEMS AND STATISTICS | 18713.0 | 13496.0 | 5217.0 | Business | 0.278790 | 278 | 16413 | ... | 2420 | 13017 | 1015 | 0.058240 | 51000 | 38000 | 60000 | 6342 | 5741 | 708 |
| 25 | 26 | 2406 | CIVIL ENGINEERING | 53153.0 | 41081.0 | 12072.0 | Engineering | 0.227118 | 565 | 43041 | ... | 10080 | 29196 | 3270 | 0.070610 | 50000 | 40000 | 60000 | 28526 | 9356 | 2899 |
| 26 | 27 | 5601 | CONSTRUCTION SERVICES | 18498.0 | 16820.0 | 1678.0 | Industrial Arts & Consumer Services | 0.090713 | 295 | 16318 | ... | 1751 | 12313 | 1042 | 0.060023 | 50000 | 36000 | 60000 | 3275 | 5351 | 703 |
| 27 | 28 | 6204 | OPERATIONS LOGISTICS AND E-COMMERCE | 11732.0 | 7921.0 | 3811.0 | Business | 0.324838 | 156 | 10027 | ... | 1183 | 7724 | 504 | 0.047859 | 50000 | 40000 | 60000 | 1466 | 3629 | 285 |
| 28 | 29 | 2499 | MISCELLANEOUS ENGINEERING | 9133.0 | 7398.0 | 1735.0 | Engineering | 0.189970 | 118 | 7428 | ... | 1662 | 5476 | 597 | 0.074393 | 50000 | 39000 | 65000 | 3445 | 2426 | 365 |
| 29 | 30 | 5402 | PUBLIC POLICY | 5978.0 | 2639.0 | 3339.0 | Law & Public Policy | 0.558548 | 55 | 4547 | ... | 1306 | 2776 | 670 | 0.128426 | 50000 | 35000 | 70000 | 1550 | 1871 | 340 |
| 30 | 31 | 2410 | ENVIRONMENTAL ENGINEERING | 4047.0 | 2662.0 | 1385.0 | Engineering | 0.342229 | 26 | 2983 | ... | 930 | 1951 | 308 | 0.093589 | 50000 | 42000 | 56000 | 2028 | 830 | 260 |
| ... | ... | ... | ... | ... | ... | ... | ... | ... | ... | ... | ... | ... | ... | ... | ... | ... | ... | ... | ... | ... | ... |
| 143 | 144 | 1105 | PLANT SCIENCE AND AGRONOMY | 7416.0 | 4897.0 | 2519.0 | Agriculture & Natural Resources | 0.339671 | 110 | 6594 | ... | 1246 | 4522 | 314 | 0.045455 | 32000 | 22900 | 40000 | 2089 | 3545 | 1231 |
| 144 | 145 | 2308 | SCIENCE AND COMPUTER TEACHER EDUCATION | 6483.0 | 2049.0 | 4434.0 | Education | 0.683943 | 59 | 5362 | ... | 1227 | 3247 | 266 | 0.047264 | 32000 | 28000 | 39000 | 4214 | 1106 | 591 |
| 145 | 146 | 5200 | PSYCHOLOGY | 393735.0 | 86648.0 | 307087.0 | Psychology & Social Work | 0.779933 | 2584 | 307933 | ... | 115172 | 174438 | 28169 | 0.083811 | 31500 | 24000 | 41000 | 125148 | 141860 | 48207 |
| 146 | 147 | 6002 | MUSIC | 60633.0 | 29909.0 | 30724.0 | Arts | 0.506721 | 419 | 47662 | ... | 24943 | 21425 | 3918 | 0.075960 | 31000 | 22300 | 42000 | 13752 | 28786 | 9286 |
| 147 | 148 | 2306 | PHYSICAL AND HEALTH EDUCATION TEACHING | 28213.0 | 15670.0 | 12543.0 | Education | 0.444582 | 259 | 23794 | ... | 7230 | 13651 | 1920 | 0.074667 | 31000 | 24000 | 40000 | 12777 | 9328 | 2042 |
| 148 | 149 | 6006 | ART HISTORY AND CRITICISM | 21030.0 | 3240.0 | 17790.0 | Humanities & Liberal Arts | 0.845934 | 204 | 17579 | ... | 6140 | 9965 | 1128 | 0.060298 | 31000 | 23000 | 40000 | 5139 | 9738 | 3426 |
| 149 | 150 | 6000 | FINE ARTS | 74440.0 | 24786.0 | 49654.0 | Arts | 0.667034 | 623 | 59679 | ... | 23656 | 31877 | 5486 | 0.084186 | 30500 | 21000 | 41000 | 20792 | 32725 | 11880 |
| 150 | 151 | 2901 | FAMILY AND CONSUMER SCIENCES | 58001.0 | 5166.0 | 52835.0 | Industrial Arts & Consumer Services | 0.910933 | 518 | 46624 | ... | 15872 | 26906 | 3355 | 0.067128 | 30000 | 22900 | 40000 | 20985 | 20133 | 5248 |
| 151 | 152 | 5404 | SOCIAL WORK | 53552.0 | 5137.0 | 48415.0 | Psychology & Social Work | 0.904075 | 374 | 45038 | ... | 13481 | 27588 | 3329 | 0.068828 | 30000 | 25000 | 35000 | 27449 | 14416 | 4344 |
| 152 | 153 | 1103 | ANIMAL SCIENCES | 21573.0 | 5347.0 | 16226.0 | Agriculture & Natural Resources | 0.752144 | 255 | 17112 | ... | 5353 | 10824 | 917 | 0.050862 | 30000 | 22000 | 40000 | 5443 | 9571 | 2125 |
| 153 | 154 | 6003 | VISUAL AND PERFORMING ARTS | 16250.0 | 4133.0 | 12117.0 | Arts | 0.745662 | 132 | 12870 | ... | 6253 | 6322 | 1465 | 0.102197 | 30000 | 22000 | 40000 | 3849 | 7635 | 2840 |
| 154 | 155 | 2312 | TEACHER EDUCATION: MULTIPLE LEVELS | 14443.0 | 2734.0 | 11709.0 | Education | 0.810704 | 142 | 13076 | ... | 2214 | 8457 | 496 | 0.036546 | 30000 | 24000 | 37000 | 10766 | 1949 | 722 |
| 155 | 156 | 5299 | MISCELLANEOUS PSYCHOLOGY | 9628.0 | 1936.0 | 7692.0 | Psychology & Social Work | 0.798920 | 60 | 7653 | ... | 3221 | 3838 | 419 | 0.051908 | 30000 | 20800 | 40000 | 2960 | 3948 | 1650 |
| 156 | 157 | 5403 | HUMAN SERVICES AND COMMUNITY ORGANIZATION | 9374.0 | 885.0 | 8489.0 | Psychology & Social Work | 0.905590 | 89 | 8294 | ... | 2405 | 5061 | 326 | 0.037819 | 30000 | 24000 | 35000 | 2878 | 4595 | 724 |
| 157 | 158 | 3402 | HUMANITIES | 6652.0 | 2013.0 | 4639.0 | Humanities & Liberal Arts | 0.697384 | 49 | 5052 | ... | 2225 | 2661 | 372 | 0.068584 | 30000 | 20000 | 49000 | 1168 | 3354 | 1141 |
| 158 | 159 | 4901 | THEOLOGY AND RELIGIOUS VOCATIONS | 30207.0 | 18616.0 | 11591.0 | Humanities & Liberal Arts | 0.383719 | 310 | 24202 | ... | 8767 | 13944 | 1617 | 0.062628 | 29000 | 22000 | 38000 | 9927 | 12037 | 3304 |
| 159 | 160 | 6007 | STUDIO ARTS | 16977.0 | 4754.0 | 12223.0 | Arts | 0.719974 | 182 | 13908 | ... | 5673 | 7413 | 1368 | 0.089552 | 29000 | 19200 | 38300 | 3948 | 8707 | 3586 |
| 160 | 161 | 2201 | COSMETOLOGY SERVICES AND CULINARY ARTS | 10510.0 | 4364.0 | 6146.0 | Industrial Arts & Consumer Services | 0.584776 | 117 | 8650 | ... | 2064 | 5949 | 510 | 0.055677 | 29000 | 20000 | 36000 | 563 | 7384 | 3163 |
| 161 | 162 | 1199 | MISCELLANEOUS AGRICULTURE | 1488.0 | 404.0 | 1084.0 | Agriculture & Natural Resources | 0.728495 | 24 | 1290 | ... | 335 | 936 | 82 | 0.059767 | 29000 | 23000 | 42100 | 483 | 626 | 31 |
| 162 | 163 | 5502 | ANTHROPOLOGY AND ARCHEOLOGY | 38844.0 | 11376.0 | 27468.0 | Humanities & Liberal Arts | 0.707136 | 247 | 29633 | ... | 14515 | 13232 | 3395 | 0.102792 | 28000 | 20000 | 38000 | 9805 | 16693 | 6866 |
| 163 | 164 | 6102 | COMMUNICATION DISORDERS SCIENCES AND SERVICES | 38279.0 | 1225.0 | 37054.0 | Health | 0.967998 | 95 | 29763 | ... | 13862 | 14460 | 1487 | 0.047584 | 28000 | 20000 | 40000 | 19957 | 9404 | 5125 |
| 164 | 165 | 2307 | EARLY CHILDHOOD EDUCATION | 37589.0 | 1167.0 | 36422.0 | Education | 0.968954 | 342 | 32551 | ... | 7001 | 20748 | 1360 | 0.040105 | 28000 | 21000 | 35000 | 23515 | 7705 | 2868 |
| 165 | 166 | 2603 | OTHER FOREIGN LANGUAGES | 11204.0 | 3472.0 | 7732.0 | Humanities & Liberal Arts | 0.690111 | 56 | 7052 | ... | 3685 | 3214 | 846 | 0.107116 | 27500 | 22900 | 38000 | 2326 | 3703 | 1115 |
| 166 | 167 | 6001 | DRAMA AND THEATER ARTS | 43249.0 | 14440.0 | 28809.0 | Arts | 0.666119 | 357 | 36165 | ... | 15994 | 16891 | 3040 | 0.077541 | 27000 | 19200 | 35000 | 6994 | 25313 | 11068 |
| 167 | 168 | 3302 | COMPOSITION AND RHETORIC | 18953.0 | 7022.0 | 11931.0 | Humanities & Liberal Arts | 0.629505 | 151 | 15053 | ... | 6612 | 7832 | 1340 | 0.081742 | 27000 | 20000 | 35000 | 4855 | 8100 | 3466 |
| 168 | 169 | 3609 | ZOOLOGY | 8409.0 | 3050.0 | 5359.0 | Biology & Life Science | 0.637293 | 47 | 6259 | ... | 2190 | 3602 | 304 | 0.046320 | 26000 | 20000 | 39000 | 2771 | 2947 | 743 |
| 169 | 170 | 5201 | EDUCATIONAL PSYCHOLOGY | 2854.0 | 522.0 | 2332.0 | Psychology & Social Work | 0.817099 | 7 | 2125 | ... | 572 | 1211 | 148 | 0.065112 | 25000 | 24000 | 34000 | 1488 | 615 | 82 |
| 170 | 171 | 5202 | CLINICAL PSYCHOLOGY | 2838.0 | 568.0 | 2270.0 | Psychology & Social Work | 0.799859 | 13 | 2101 | ... | 648 | 1293 | 368 | 0.149048 | 25000 | 25000 | 40000 | 986 | 870 | 622 |
| 171 | 172 | 5203 | COUNSELING PSYCHOLOGY | 4626.0 | 931.0 | 3695.0 | Psychology & Social Work | 0.798746 | 21 | 3777 | ... | 965 | 2738 | 214 | 0.053621 | 23400 | 19200 | 26000 | 2403 | 1245 | 308 |
| 172 | 173 | 3501 | LIBRARY SCIENCE | 1098.0 | 134.0 | 964.0 | Education | 0.877960 | 2 | 742 | ... | 237 | 410 | 87 | 0.104946 | 22000 | 20000 | 22000 | 288 | 338 | 192 |
172 rows × 21 columns
Let’s begin exploring the data using scatter plots and see if we can draw any interesting correlations.
1
2
3
4
5
6
recent_grads.plot(x='Sample_size', y='Median', kind = 'scatter')
recent_grads.plot(x='Sample_size', y='Unemployment_rate', kind = 'scatter')
recent_grads.plot(x='Full_time', y='Median', kind = 'scatter')
recent_grads.plot(x='ShareWomen', y='Unemployment_rate', kind = 'scatter')
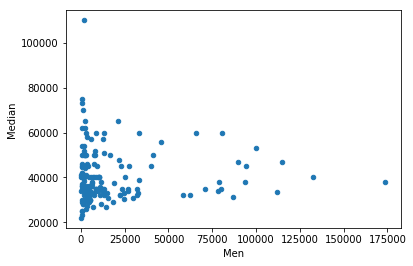
recent_grads.plot(x='Men', y='Median', kind = 'scatter')
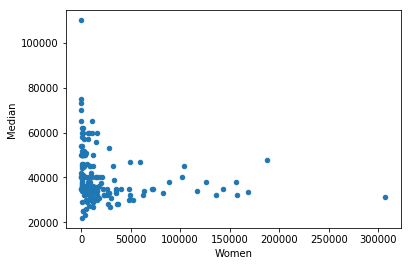
recent_grads.plot(x='Women', y='Median', kind = 'scatter')
1
<matplotlib.axes._subplots.AxesSubplot at 0x14dae4fb710>
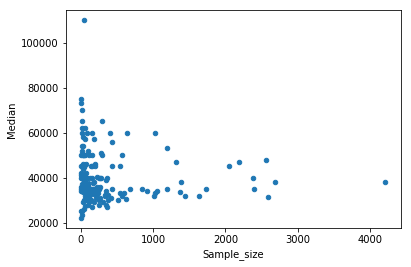
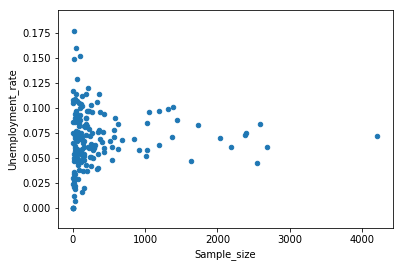
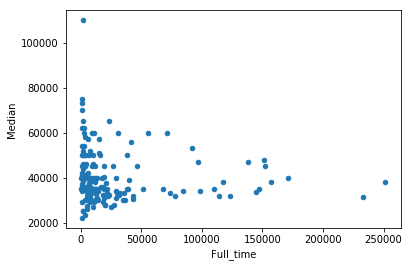
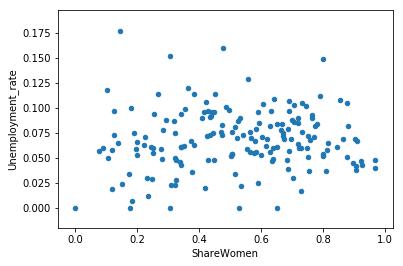
From the ‘Unemployment_rate’ vs. ‘ShareWomen’ plot, it looks like there is no correlation between unemployment rate and the amount of women in the major.
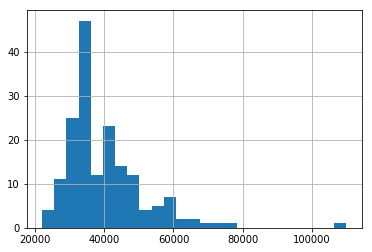
Doesn’t look like there is much other useful information from these scatter plots, let’s explore the data a bit further using histograms instead.
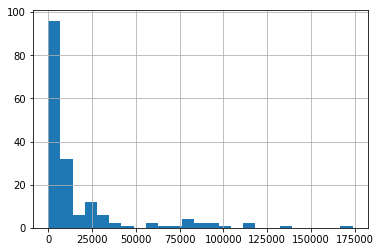
The y axis shows the frequency of the data and the x axis refers to the column name specified in code.
1
recent_grads['Median'].hist(bins=25)
1
<matplotlib.axes._subplots.AxesSubplot at 0x14dae502a90>
1
2
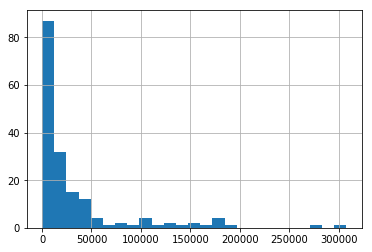
recent_grads['Employed'].hist(bins=25)
1
<matplotlib.axes._subplots.AxesSubplot at 0x14dae4c74e0>
1
2
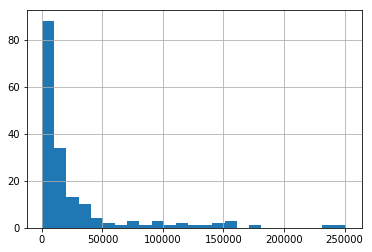
recent_grads['Full_time'].hist(bins=25)
1
<matplotlib.axes._subplots.AxesSubplot at 0x14dae7e7c50>
1
2
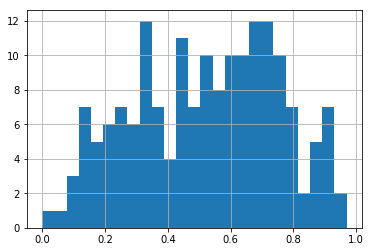
recent_grads['ShareWomen'].hist(bins=25)
1
<matplotlib.axes._subplots.AxesSubplot at 0x14dae843cf8>
1
2
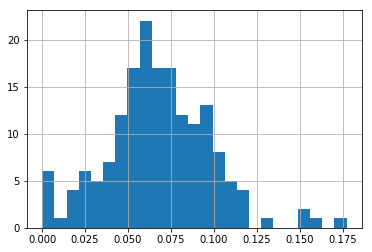
recent_grads['Unemployment_rate'].hist(bins=25)
1
<matplotlib.axes._subplots.AxesSubplot at 0x14dae4abf28>
1
2
recent_grads['Men'].hist(bins=25)
1
<matplotlib.axes._subplots.AxesSubplot at 0x14dae77a978>
1
recent_grads['Women'].hist(bins=25)
1
<matplotlib.axes._subplots.AxesSubplot at 0x14dae45f518>
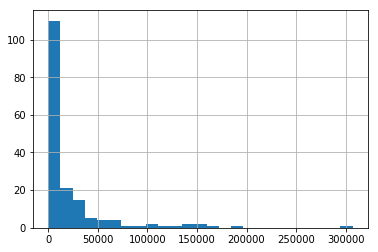
Again, not much correlation from these histograms. We do see a distribution of unemployment rates for various majors. If unemployment rate is not related to major, then we should see a wide plateau on the histogram.
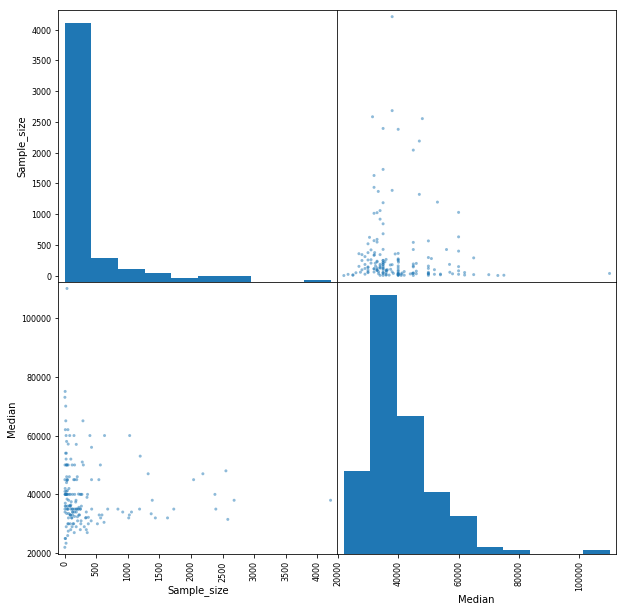
Next we’ll use scatter matrix from pandas to see if we can draw more insight. A scatter matrix can plot many different variables together and allow us to quickly see if there are correlations between those variables.
1
from pandas.plotting import scatter_matrix
1
scatter_matrix(recent_grads[['Sample_size', 'Median']], figsize=(10,10))
1
2
3
4
array([[<matplotlib.axes._subplots.AxesSubplot object at 0x0000014DAE8F52E8>,
        <matplotlib.axes._subplots.AxesSubplot object at 0x0000014DAE92AE80>],
       [<matplotlib.axes._subplots.AxesSubplot object at 0x0000014DAE94DE80>,
        <matplotlib.axes._subplots.AxesSubplot object at 0x0000014DAE978400>]], dtype=object)
1
scatter_matrix(recent_grads[['Men', 'ShareWomen', 'Median']], figsize=(10,10))
1
2
3
4
5
6
7
8
9
array([[<matplotlib.axes._subplots.AxesSubplot object at 0x0000014DAE9E4E48>,
        <matplotlib.axes._subplots.AxesSubplot object at 0x0000014DAEA354E0>,
        <matplotlib.axes._subplots.AxesSubplot object at 0x0000014DAEA59550>],
       [<matplotlib.axes._subplots.AxesSubplot object at 0x0000014DAEA6C860>,
        <matplotlib.axes._subplots.AxesSubplot object at 0x0000014DAEAA1550>,
        <matplotlib.axes._subplots.AxesSubplot object at 0x0000014DAEABAE80>],
       [<matplotlib.axes._subplots.AxesSubplot object at 0x0000014DAEADFF60>,
        <matplotlib.axes._subplots.AxesSubplot object at 0x0000014DAEB03F60>,
        <matplotlib.axes._subplots.AxesSubplot object at 0x0000014DAEB25F60>]], dtype=object)
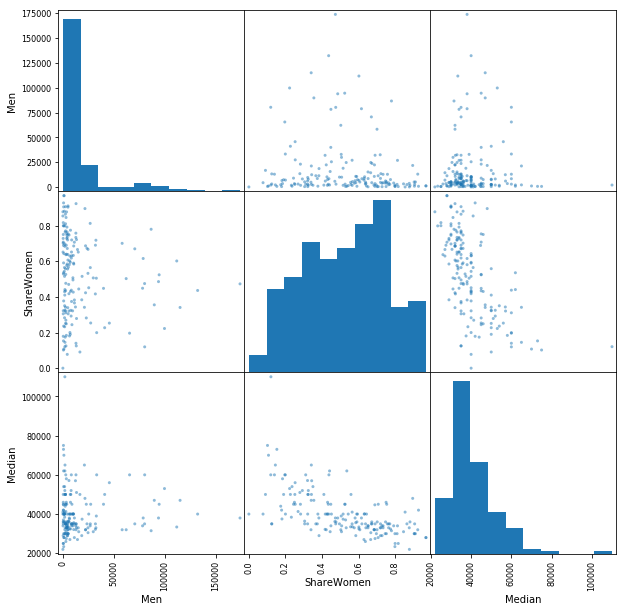
We are not really seeing much correlations betwen these plots, There is a weak negative correlation between ‘ShareWomen’ and Median. Majors with less women tend to have higher earnings. It could be due to the fact that high paying majors like engineering tend to have less women.
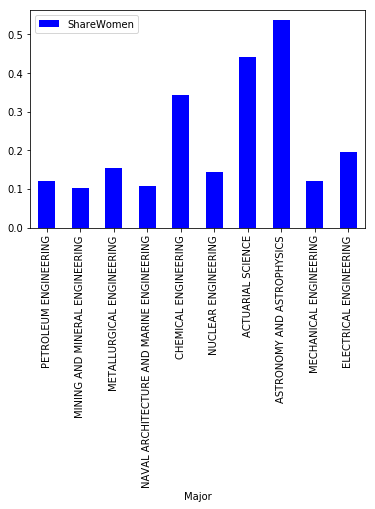
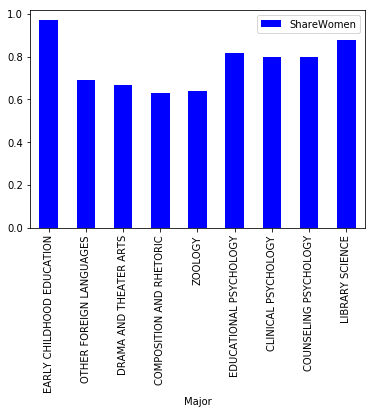
The first ten rows in the data are mostly engineering majors, and the last ten rows are non engineering majors. We can generate a bar chart and look at the ‘ShareWomen’ vs ‘Majors’ to see if our hypothesis is correct.
1
2
recent_grads[:10].plot(kind='bar', x='Major', y='ShareWomen', colormap='winter')
recent_grads[163:].plot(kind='bar', x='Major', y='ShareWomen', colormap='winter')
1
<matplotlib.axes._subplots.AxesSubplot at 0x14daedf7fd0>
Let’s plot the majors we selected above with ‘Median’ income to see if engineers earn more income.
1
2
recent_grads[:10].plot(kind='bar', x='Major', y='Median', colormap='winter')
recent_grads[163:].plot(kind='bar', x='Major', y='Median', colormap='winter')
1
<matplotlib.axes._subplots.AxesSubplot at 0x14daee985c0>
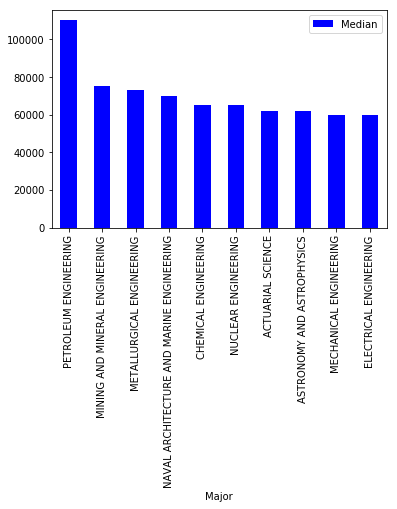
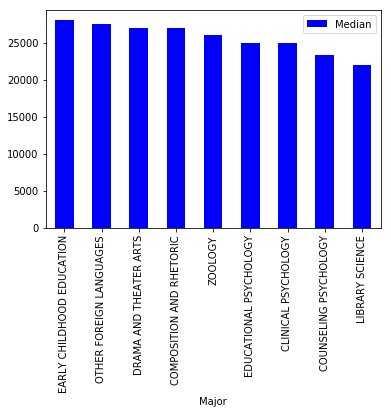
Our hypothesis appears to be correct, at least for the majors we selected. Majors with less women such as engineering tend to earn higher salaries.
Learning Summary
Python concepts explored: pandas, matplotlib, histograms, bar charts, scatterplots, scatter matrices
Python functions and methods used: .plot(), scatter_matrix(), hist(), iloc[], .head(), .tail(), .describe()
The files used for this project can be found in my GitHub repository.